Blog Editor’s Note: In a recent GPS World article on it’s interference detection system, NovAtel included three examples of GPS signal disruption that have been detected by its system. We enthusiastically support broad sharing of these kinds of case studies to educate and create more responsible and resilient users.
Here is the first of the three case studies:
INDIA DATASET
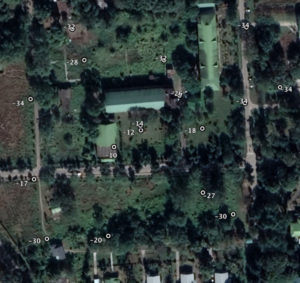
This dataset was the initial motivation for this work. A customer reported intermittent tracking problems with a newly installed receiver. The receiver would stop tracking for a few hours every evening. Customer service visited the site to investigate. Because of the intermittent nature of the problem, interference was suspected. An OEM729 receiver was walked around the affected antenna in an attempt to find the source of the interference and also to prove to the customer that interference was in fact the cause of the tracking problems.
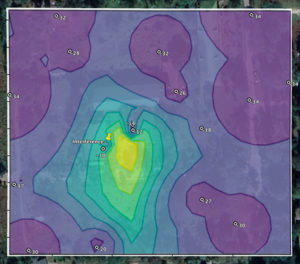
FIGURE 8 shows the collected measurements. The numbers shown are the received interference powers at each location. It is possible to approximate the location of the interference and the impacted area by looking closely at the measurements, but it takes some close examination and interpretation.
The source of the interference was identified using this approach. It was found to be a weather station, which performs a nightly upload of data collected throughout the day. This weather station broadcasts at 1580 MHz, which was jamming L1. The customer was able to move the interfering antenna to another site. The customer also could have used the ITK to apply a notch filter, which would have mitigated the interference’s impact, but it is better to remove the source of interference if possible.
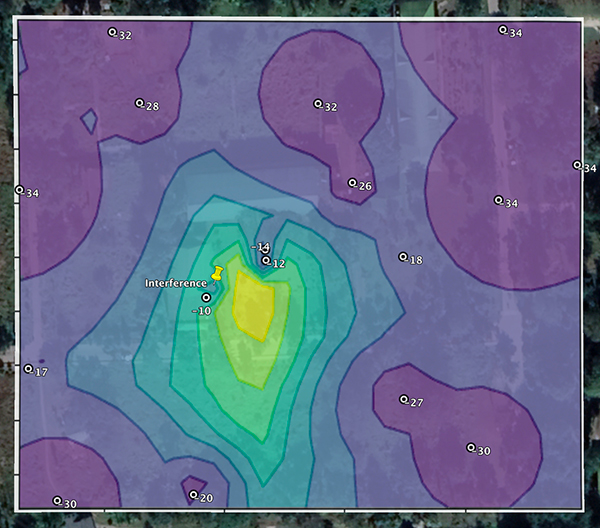
Using the data points collected, an interference map can be generated using the method described. This map is shown in FIGURE 9. The lighter color indicates a higher likelihood that the interference transmitter is at that location. The location of the transmitter is also shown in the figure. The likelihood map is very close to the actual location of the transmitter. It gives a quick and easy-to-interpret visualization as opposed to individual measurement points.
